Essay
New ARR Formulas in AI SaaS
Why AI application companies are hitting $100M ARR in months, what they actually mean when they say ARR, and whether the unit economics can hold once the subsidies thin out.
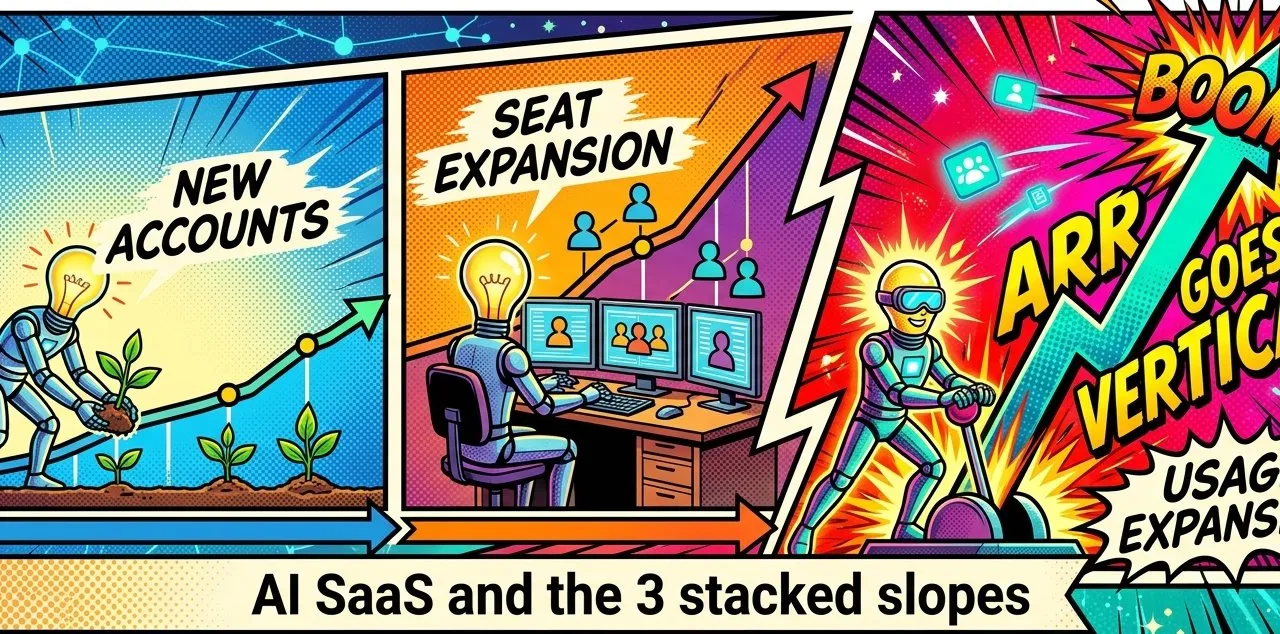
Over the last two years, AI application companies have started hitting revenue milestones that used to take a full SaaS generation. The old benchmark was $100M ARR. In classic SaaS, that usually took years. In AI coding and app-building tools, some teams now claim it in months. Bessemer’s Centaur Report treated $100M ARR as a meaningful operating milestone for private SaaS companies, and Sacra’s benchmark work shows how rare that speed used to be.
The reaction is predictable. Some of these numbers are real. Some come from usage-based pricing. Some come from how ARR is defined. All three can be true at once.
This post looks at four questions. Why does $100M ARR matter? Why are AI application companies reaching it so fast? What do they mean when they say ARR? And can the economics hold once subsidies thin out?
1. Why $100M ARR matters
Bessemer coined the term “Centaur” for a private SaaS company that crosses $100M in ARR. The term matters because revenue is harder to fake than valuation. It implies paying customers, some retention, and a repeatable distribution engine. The original BVP framing still holds.
Historically, $100M ARR was a slow climb. Salesforce took a little over five years to cross $100M in revenue. Slack did it in roughly two and a half years. Wiz reset the benchmark at about 18 months. Even that looked extreme at the time. Sacra’s review of the leaderboard and EquityZen’s summary of the AI-era compression show how unusual the new pace is.
The milestone also used to bundle together several hard things: product-market fit, go-to-market discipline, retention, and scale. AI application companies sometimes reach the same top-line number faster because demand is steeper and the pricing model is different. L.E.K.’s analysis of AI SaaS metrics and Metronome’s work on usage-heavy SaaS both point to that shift.
2. Recent examples
Cursor
Cursor is the clearest example. It started as a fork of VS Code with a much stronger AI workflow. Sacra’s timeline shows the jump from roughly $1M ARR in December 2023 to $100M ARR in January 2025. SaaStr later covered Cursor’s rise to $1B ARR and argued that no B2B software company had scaled faster.
The product also changed as it grew. Autocomplete mattered at first. Agentic workflows mattered more later. Cursor’s Composer mode pushed the product from assistant toward operator. That made heavier usage rational and enterprise budgets easier to justify. Cursor’s pricing and its Series D announcement show the shift from individual users to a large enterprise mix.
Lovable
Lovable followed a similar curve in a different market. The pitch was simple: describe an app in English, get a working full-stack project back. Entrepreneur’s reporting on Lovable places the company at $10M ARR within months of launch and at $100M ARR by mid-2025. SiliconAngle’s coverage of its Series B describes a company growing quickly with a very small team.
Lovable also shows how broad the buyer base can be. The user is often not just an engineer. Product people, designers, founders, and operators can all generate usage. That matters for the revenue model. Lovable’s credit documentation makes the pricing structure explicit.
Replit
Replit is older and should be read differently. It spent years building distribution, community, and an in-browser development environment before the AI wave. The big jump came after Replit Agent. Wikipedia’s company history, SaaStr’s writeup on the $100M milestone, and Sacra’s analysis of Replit at $253M ARR point to the same pattern: an established product found a steeper slope when the interface shifted from editor to agent.
That distinction matters. Replit did not appear from nowhere. The AI agent wave was an accelerant, not the whole story.
Emergent
Emergent is the most contested case. Economic Times reported that the company went from launch to $15M ARR in about 90 days, then to $50M ARR, then to $100M ARR very quickly. Business Standard’s interview with Mukund Jha gives the company’s own account of that growth.
The Emergent debate matters even without accusing anyone of anything. It forced a more useful question: what exactly counts as ARR in AI SaaS? Outlook Business covered that debate directly, and Business Insider’s broader analysis captured the core concern: consumption spikes can look like recurring revenue when annualized aggressively.
3. The third derivative of growth
The fastest AI SaaS companies have a different revenue curve because they add one more slope to the system.
In classic SaaS, the first slope is simple: win more accounts. Per-seat SaaS adds a second slope: each account can grow its seat count over time. AI SaaS adds a third slope: each seat can consume more every month. I am using “third derivative” loosely here, as shorthand for one more slope stacked on top of the last one.
That is the key idea. A normal SaaS company can grow because it signs more customers. A better SaaS company can also grow because those customers hire more people. An AI SaaS company can grow on both of those axes and then grow again because each user consumes more credits, tokens, or actions over time.
First slope: account growth
The first slope is ordinary. Sell to more companies and revenue goes up. Flat-price SaaS lives here. A tool with one fixed plan grows only when logo count grows. Product-led growth can reduce acquisition cost, but it does not change the math. Atlassian’s writing on its flywheel is a clean example.
This slope is still labor-bound. Enterprise sales need demos, procurement, security review, and implementation. Even product-led companies usually add a sales motion once deal size rises. SaaStr’s coverage of enterprise AI go-to-market shows how quickly the best AI companies add enterprise muscle after the initial bottom-up wave.
First slope. Flat-price SaaS grows by logo count alone. The steps are identical, so the envelope is a straight line — and every step costs a sales cycle.
Second slope: seat expansion
Per-seat pricing adds a second slope. If the customer grows, your revenue grows with it. GitHub Copilot charges per seat. Slack charges per seat. Linear charges per seat. GitHub’s Copilot Enterprise launch post, Slack pricing references, and Linear’s price update show the standard structure.
If you sell to startups, you inherit their hiring curve. A company that doubles its engineering headcount can double your revenue without an upsell call. SaaS operators usually measure this through net revenue retention. Slack’s peak NRR, Snowflake’s long-run NRR profile, and Datadog’s expansion-driven growth show how valuable this second slope is.
Second slope. Per-seat pricing inherits the customer’s hiring curve, so the same signed logos keep adding revenue. The staircase bends away from the flat-price line without a single new deal.
There is a limit. Seat expansion only tracks the functions that use your tool. GitHub benefits when engineering grows. It does not benefit when finance grows. Atlassian spent years widening Jira’s footprint across departments for exactly this reason. Atlassian’s shareholder letter and commentary on its user mix explain the strategy.
Third slope: usage expansion
This is the new piece. Traditional SaaS usually charges the same amount whether a user touches the product once a week or all day. AI products often cannot do that because inference has a real marginal cost. That pushes the category toward credits, tokens, actions, or hybrid pricing. Ordway’s work on cloud usage-based ARR, Metronome’s usage-heavy SaaS notes, and L.E.K.’s AI pricing analysis all describe the shift.
Lovable prices by credits. Cursor gives users a credit pool. Bolt.new prices by token volume. Heavy users move up the pricing ladder on their own. Lovable’s credit FAQ, Cursor pricing, and Sacra’s Bolt.new profile show three versions of the same pattern.
Once a user depends on one of these tools, usage often rises. Alger’s writeup on OpenAI’s momentum cites average token consumption per organization growing about 320x over a twelve-month period, and Entree Capital’s analysis notes the jump in total API throughput. That is the third slope in the wild: more usage from the same seat inside the same account.
Third slope. Credit and token pricing lets revenue rise inside a seat that was already sold. The curve bends hardest where nothing about the customer count changed.
When the third derivative appears
The ARR formula in classic SaaS is usually close to this:
ARR = accounts x seats per account x price per seatIn AI SaaS, there is often one more term:
ARR = accounts x seats per account x consumption per seat x price per unitThe same revenue, decomposed. Classic SaaS gets the bottom band and, if it prices per seat, the middle one. Usage pricing adds the top band — the part that grows without a new deal or a new hire.
That extra variable is what gives you the third derivative of growth. SaaStr on Cursor’s pace, Sacra on Lovable, and Sacra on Bolt.new show how quickly the curve bends once usage expands inside each seat.
That is why the current wave looks so unusual. These companies are often acquiring customers, selling into growing teams, and seeing each user consume more over time. The first slope comes from sales. The second and third slopes can compound with much less direct effort.
4. How ARR gets calculated
Once you accept that the growth can be real, the next question gets harder: what exactly does the ARR number measure?
ARR and annualized run rate
The acronym ARR is used for two related but different ideas. Annual Recurring Revenue is the annual value of live recurring contracts. Annualized Run Rate takes a recent revenue period and multiplies it forward. Last month times twelve. Last week times fifty-two. Yesterday times three hundred sixty-five. Stripe’s guides on ARR, annualized run rate, and ChartMogul’s ARR definition make the distinction clear.
In a stable subscription business, the gap between the two may be small. In a fast-growing usage-based business, it can be huge. A spike month tells you something about demand. It does not tell you next year’s recurring revenue.
Bookings, CARR, live ARR, and GAAP revenue
A signed contract becomes several different numbers before it becomes recognized revenue. Bookings counts contract value when the deal is signed. CARR counts the annualized committed value of signed contracts, including deals that are not live yet. Live ARR counts what customers are actually being billed for now. GAAP revenue recognizes the subscription over time as service is delivered. Corporate Finance Institute on bookings versus ARR, Stripe on CARR, Tremendous on contracted versus live ARR, and Sensiba on ARR versus GAAP revenue explain the stack.
Each figure can be presented honestly. Trouble starts when the company does not say which one it is using.
Discounts and trial users
Discounting widens the gap further. Suppose a $20 monthly plan is sold for $1 in month one. Cash collected today is $1. A very aggressive ARR calculation can still count that user at $240 of annual value if the product reverts to full price next month. Sign up 100 such users and the company can claim $24,000 of ARR with only $100 collected so far. Burkland’s discussion of early-stage ARR nuance and HubiFi’s ARR versus revenue explainer show why investors discount heavily promoted cohorts.
Free trials push the same issue further. If no payment has happened, the cleanest ARR treatment is zero. Some companies count trial users as future pipeline or committed ARR. Others blend them into headline ARR. The SaaS CFO’s guidance and CFO Pro Analytics on ASC 606 and free trials explain why conservative finance teams avoid that.
Usage-based revenue
Usage-based revenue breaks old SaaS intuition. A customer can spend $8,000 in January, $15,000 in February, and $9,000 in March. Annualize February and you get a far larger ARR number than if you annualize March. The customer has not changed. The usage pattern has. The SaaS CFO’s review of SEC methodologies shows that public companies like MongoDB, Datadog, and Confluent use different formulas for exactly this reason.
There is no single standard. Some annualize the last month. Some use the trailing three-month average. Some count only committed minimums. Each method answers a different question. Ordway’s summary of cloud usage ARR methods is useful here.
This matters a lot in AI. Early usage is often exploratory. A team can try a tool intensely for two weeks and then stop. If you annualize that spike, you get a large number that looks recurring even when the behavior was temporary. Sifted’s reporting on AI startups and run-rate culture captures how common this became in 2024 and 2025.
Layered assumptions
The most misleading cases stack several assumptions. Discounted signups get counted at full annual value. A high-usage day gets annualized. Then the daily ARR addition gets projected across a full year. Each step has a logic. The combined result can drift very far from cash reality. Baremetrics on annual run rate and Stripe on annualized run rate warn against exactly this pattern.
That does not prove any specific headline is wrong. It does mean the method matters as much as the number. Without the method, the number is hard to interpret.
What good reporting looks like
The cleanest way to inspect ARR quality is the ARR bridge. Start with beginning ARR. Add new ARR. Add expansion ARR. Subtract contraction and churn. What remains is ending ARR. HubiFi’s ARR waterfall guide and Prospeo’s ARR waterfall explainer give the standard structure.
Then ask for net revenue retention. If no new customers arrived, would revenue from the existing base rise, stay flat, or shrink? World-class SaaS usually keeps NRR above 120%. Allison Pickens on Growth Endurance and CFI on GRR versus NRR explain why investors care.
For AI products, NRR is central. If customers use the product more each month and stay, the high ARR multiple has a foundation. If churn is high and growth comes mostly from new acquisition, the headline ARR deserves much less trust.
5. Can the economics hold?
So far the story has focused on demand and reporting. The harder question is cost. Heavy AI usage feels cheap at the keyboard. It is expensive somewhere in the stack.
Token costs
Agentic coding workloads consume a lot of tokens because they carry long prompts, codebase context, tool calls, and large outputs. Frontier model prices have fallen, but heavy daily usage still creates meaningful cost. Anthropic’s pricing page, ZDNet’s note on falling GPT-4 class prices, and Introl’s inference cost breakdown help bound the economics.
At light usage, the cost is manageable. At organizational scale, it grows quickly. A company with many engineers using AI deeply each day can end up spending millions a year in token-equivalent costs.
Subsidies
A large share of present-day AI usage is subsidized somewhere. Model labs have often priced below full serving cost. API credits from cloud providers and investors are common. AI startups receive compute credits. Enterprises often buy seats without metering internal usage closely. The effective price paid by the end user can be far below the system cost. WheresYoured on AI losses, the LessWrong summary of OpenAI’s 2024 economics, Intuition Labs on LLM pricing and margins, and a16z’s investment list and ecosystem support show different layers of that chain.
Subsidies help markets form. They also hide the steady-state economics.
Gross margins
The application companies in the middle have a harder margin problem than classic SaaS. Their cost of goods sold rises each time a user runs a powerful model. Sacra on Replit, Sacra on Cursor, and Entrepreneur Loop on Lovable’s economics suggest gross margins well below traditional SaaS at comparable stages.
The hopeful case is clear. Token costs keep falling faster than subscription prices, so gross margins improve over time. GetLago’s analysis of AI coding tool pricing explains why many investors are underwriting that bet. Timing matters, though. If users churn before model costs fall enough, the business looks much weaker.
Productivity evidence
The buyer case depends on productivity. The evidence is real but mixed. Some studies show large gains for coding tasks. A Microsoft, MIT, and Wharton trial summarized by InfoQ found a 26% increase in pull requests per week with GitHub Copilot. UC San Diego’s study found faster code commit completion. GitHub’s own research also found meaningful task-level benefits.
The counterpoint is important. METR’s 2025 randomized trial on experienced open-source developers working in large existing codebases found the AI-assisted group was slower. The developers still believed they were faster. McKinsey’s analysis of AI in software development points to the same issue on harder work: local task speed can be offset by review overhead, integration problems, and AI-induced tech debt.
Greenfield work and brownfield work are different. Boilerplate and architecture are different. AI helps more in some parts of software work than others.
Enterprise budgets
Large companies spent the last two years running AI pilots. Finance teams are now asking what moved on the income statement. The answers have been mixed. Gartner’s 2025 GenAI spending forecast, Deloitte-linked ROI reporting summarized here, and Old National’s summary of CFO pressure for measurable returns all show the same shift from experimentation to proof.
CFOs now care about net value. If employees save time but spend a large share of that time reviewing and correcting AI output, the economic gain shrinks. CFO Brew’s coverage of the “workslop tax” is a good shorthand for that problem.
Retention
Many self-serve AI tools attract tourists. Users sign up, generate a few artifacts, then disappear. Enterprise contracts hold better when the product becomes part of a daily workflow. L.E.K.’s retention discussion for AI SaaS and GitHub’s enterprise Copilot research with Accenture suggest that embedded products retain better than novelty products.
At the same time, overall daily workplace AI usage may be flattening among casual users even while heavy users go deeper. This analysis of Census and Federal Reserve data suggests daily use stabilized in a narrow band. If depth comes from a small power-user segment, the total market is smaller than broad cultural interest in AI would suggest.
The macro question
Eventually the gains should show up in macro data. So far they barely have. Goldman Sachs argues that measurable GDP effects are still ahead. Goldman’s longer-range bullish projection is far from Daron Acemoglu’s much more cautious estimate. The gap matters because it is really a dispute about whether present spending is building enduring productivity or financing expensive experiments.
That macro signal will lag. Buyers cannot wait forever for it. At some point the budget owner needs a simpler answer: did this tool create more value than it cost?
6. What to watch
The current AI ARR wave becomes easier to read once you separate four layers.
First, the growth can be real. Account growth, seat expansion, and usage expansion can compound together. That was rare in classic SaaS. It is common in AI tools with credit or token pricing. Metronome, L.E.K., and Sacra’s company profiles support that view.
Second, the metric can still mislead. ARR is not a GAAP term. It can mean live recurring contracts, contracted value, or an annualized run rate based on a short recent window. That difference matters much more in usage-heavy AI businesses than it did in traditional seat-based SaaS. The SaaS CFO’s review is useful here.
Third, the economics are still forming. Heavy AI usage is expensive somewhere in the stack even when it looks cheap to the user. Model providers, startup balance sheets, cloud credits, and enterprise budgets are all absorbing parts of that cost today. WheresYoured, Intuition Labs, and GetLago make that visible.
Fourth, durability will depend on retention and realized productivity, not only on top-line velocity. The key metrics are cohort retention, NRR, gross margin improvement, and whether customer output rises enough to support the spend. Bessemer’s SaaS benchmarks, Allison Pickens on Growth Endurance, and METR’s field evidence all point in that direction.
The right move is simple. Ask what part of the revenue is contractual. Ask how much comes from usage spikes. Ask what the cohorts do six months later. Ask what gross margin looks like after subsidies. Ask whether the buyer is truly better off.
That is where the new ARR formulas in AI SaaS will either harden into a lasting software category or unwind into a short-lived accounting story.